RNA-ATAC: scButterfly-B
The following tutorial demonstrate how to use scButterfly model making translation between scRNA-seq and scATAC-seq.
There are three part of this tutorial:
Read in data and load it to scButterfly. This part will tell you how to load and pre-process scRNA-seq and scATAC-seq data for scButterfly model.
Construct a scButterfly model. This part will tell you how to generate and train a scButterfly model.
Get prediction and evaluate the performance. This part will tell you how to get prediction from scButterfly model and evaluate the performance of prediction.
Read in data and load it to scButterfly
scButterfly has integrated the process of pre-processing, constructing model, training model and evaluating in scButterfly.butterfly for paired scRNA-seq and scATAC-seq. You could easily use it as follow:
[1]:
from scButterfly.butterfly import Butterfly
import scanpy as sc
[2]:
butterfly = Butterfly()
Here we use data of K562 human chronic myelogenous leukemia cell line as an example. (Longqi Liu, et al., 2019)
[3]:
RNA_data = sc.read_h5ad('CL_RNA.h5ad')
ATAC_data = sc.read_h5ad('CL_ATAC.h5ad')
[4]:
RNA_data
[4]:
AnnData object with n_obs × n_vars = 549 × 49059
    obs: 'batch', 'cell_type'
[5]:
ATAC_data
[5]:
AnnData object with n_obs × n_vars = 549 × 157358
    obs: 'batch', 'cell_type'
    var: 'chrom'
We provide data split settings in scButterfly.split_dataset for reproducibility. You could use parameters train_id, validation_id and test_id customize your own datasets splitting settings.
[6]:
from Butterfly.split_datasets import *
id_list = five_fold_split_dataset(RNA_data, ATAC_data)
train_id, validation_id, test_id = id_list[4]
Then we load data into scButterfly.
[7]:
butterfly.load_data(RNA_data, ATAC_data, train_id, test_id, validation_id)
[INFO] Butterfly: successfully load in data with

RNA data:
AnnData object with n_obs × n_vars = 549 × 49059
    obs: 'batch', 'cell_type'

ATAC data:
AnnData object with n_obs × n_vars = 549 × 157358
    obs: 'batch', 'cell_type'
    var: 'chrom'
scButterfly could pre-process data Automatically, custom settings is also provided, for more information see in API.
[8]:
butterfly.data_preprocessing()
[INFO] RNA preprocessing: normalize size factor.
[INFO] RNA preprocessing: log transform RNA data.
[INFO] RNA preprocessing: choose top 3000 genes for following training.
[INFO] ATAC preprocessing: binarizing data.
[INFO] ATAC preprocessing: filter out peaks appear lower than 0.5% cells.
[INFO] ATAC preprocessing: TF-IDF transformation.
[INFO] ATAC preprocessing: normalizing data.
Construct a scButterfly model
scButterfly model needs the information of peaks chromosomes, we should sort the ATAC data with chromosomes and tell scButterfly the count of peaks in each chromosome.
Note
To be specificly: assume that there are 3 chromosomes in ATAC profile with 6 peaks
peak |
p1 |
p2 |
p3 |
p4 |
p5 |
p6 |
|---|---|---|---|---|---|---|
chromosome |
c2 |
c1 |
c3 |
c1 |
c1 |
c2 |
We should first sort ATAC data into
peak |
p2 |
p4 |
p5 |
p1 |
p6 |
p3 |
|---|---|---|---|---|---|---|
chromosome |
c1 |
c1 |
c1 |
c2 |
c2 |
c3 |
Then set the chrom_list = [3, 2, 1], which means 3 peaks in c1, 2 in c2 and 1 in c3.
[9]:
butterfly.ATAC_data_p.var.chrom
[9]:
chr1_10292_10791            chr1
chr1_713838_714337          chr1
chr1_762665_763164          chr1
chr1_778116_778615          chr1
chr1_805064_805563          chr1
                            ...
chr9_140916730_140917229    chr9
chr9_140947829_140948328    chr9
chr9_140948839_140949338    chr9
chr9_140960343_140960842    chr9
chr9_140995395_140995894    chr9
Name: chrom, Length: 157358, dtype: category
Categories (22, object): ['chr1', 'chr2', 'chr3', 'chr4', ..., 'chr19', 'chr20', 'chr21', 'chr22']
Warning
Here we choose a data with chromosomes sorted, you should ensure that data is sorted by chromosomes before construct model.
[10]:
chrom_list = []
last_one = ''
for i in range(len(butterfly.ATAC_data_p.var.chrom)):
    temp = butterfly.ATAC_data_p.var.chrom[i]
    if temp[0 : 3] == 'chr':
        if not temp == last_one:
            chrom_list.append(1)
            last_one = temp
        else:
            chrom_list[-1] += 1
    else:
        chrom_list[-1] += 1

print(chrom_list, end="")
[16272, 7430, 8797, 7922, 2823, 4194, 4451, 7697, 8746, 2602, 6184, 11059, 4589, 1869, 5247, 9248, 6085, 9806, 8592, 8434, 8448, 6863]
[11]:
sum(chrom_list)
[11]:
157358
We use no data augmentation strategy here, for more information, see in scButterfly-T and scButterfly-C.
[12]:
butterfly.augmentation(aug_type=None)
We construct and train scButterfly model with default settings.
[13]:
butterfly.construct_model(chrom_list=chrom_list)
[INFO] Butterfly: successfully construct butterfly model.
[14]:
butterfly.train_model()
[INFO] Butterfly: training butterfly model ...
[INFO] Trainer: RNA pretraining ...
RNA pretrain: 100%|█████████████████████| 100/100 [02:27<00:00,  1.47s/it, train=0.5873, val=0.6376]
[INFO] Trainer: ATAC pretraining ...
ATAC pretrain: 100%|████████████████████| 100/100 [02:46<00:00,  1.66s/it, train=0.4602, val=0.4812]
[INFO] Trainer: Combine training ...
Combine training: 100%|█████████████████| 200/200 [06:22<00:00,  1.91s/it, train=1.5682, val=1.4238]
Get prediction and evaluate the performance
You could get cross-modal predictions using butterfly.test_model with default settings. We also provided more information metrics in this function, see in API.
[15]:
A2R_predict, R2A_predict = butterfly.test_model()
[INFO] Butterfly: testing butterfly model ...
[INFO] Tester: get predicting ...
RNA to ATAC predicting...: 100%|██████████████████████████████████████| 2/2 [00:00<00:00,  4.82it/s]
ATAC to RNA predicting...: 100%|██████████████████████████████████████| 2/2 [00:00<00:00,  2.85it/s]
[INFO] Tester: calculate neighbors graph for following test ...
[16]:
from scButterfly.calculate_cluster import calculate_cluster_index
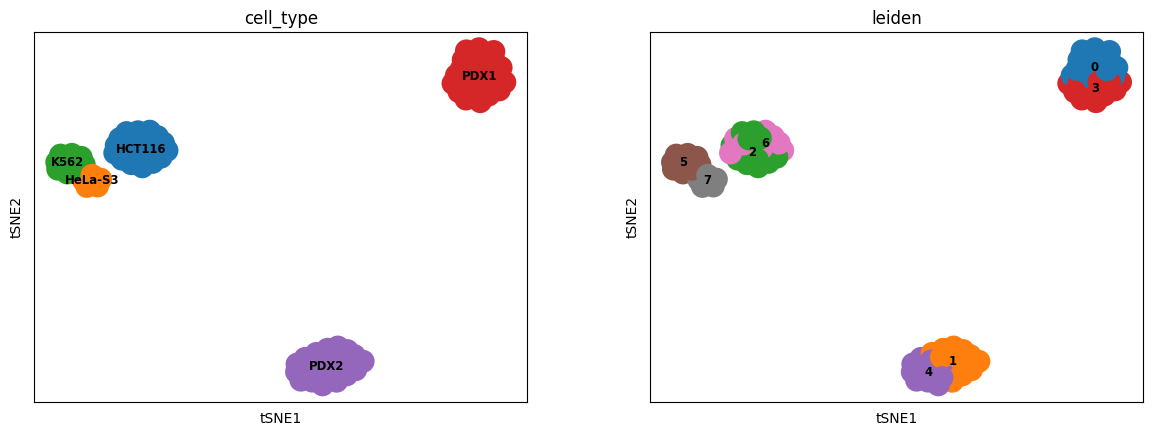
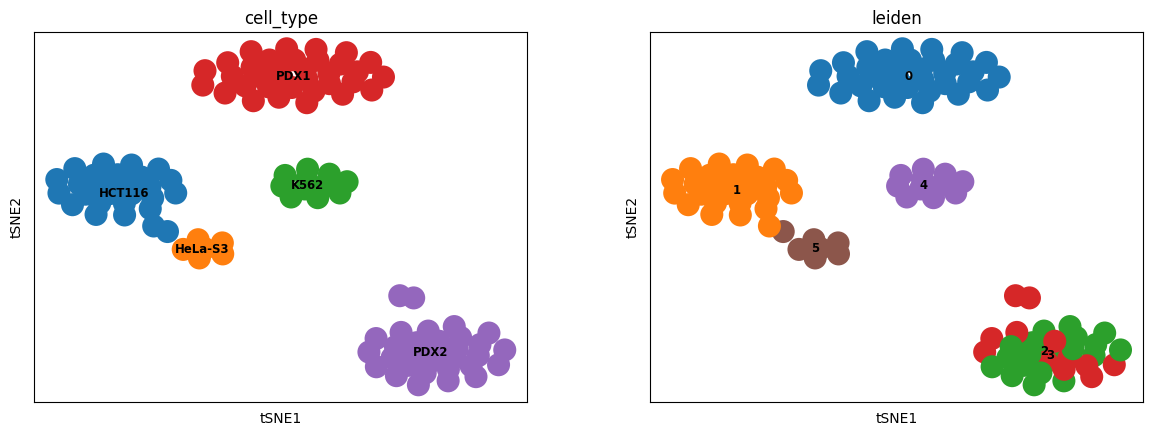
Here we draw the t-SNE embeddings and measure the ARI, AMI, NMI, and HOM.
[17]:
sc.tl.tsne(A2R_predict)
sc.tl.leiden(A2R_predict)
sc.pl.tsne(A2R_predict, color=['cell_type', 'leiden'], legend_loc='on data', legend_fontsize='small')
[18]:
ARI, AMI, NMI, HOM = calculate_cluster_index(A2R_predict)
print('ATAC to RNA:\nARI: %.3f, \tAMI: %.3f, \tNMI: %.3f, \tHOM: %.3f' % (ARI, AMI, NMI, HOM))
ATAC to RNA:
ARI: 0.620,     AMI: 0.820,     NMI: 0.835,     HOM: 1.000,     COM: 0.717
[19]:
sc.tl.tsne(R2A_predict)
sc.tl.leiden(R2A_predict)
sc.pl.tsne(R2A_predict, color=['cell_type', 'leiden'], legend_loc='on data', legend_fontsize='small')
[20]:
ARI, AMI, NMI, HOM = calculate_cluster_index(R2A_predict)
print('RNA to ATAC:\nARI: %.3f, \tAMI: %.3f, \tNMI: %.3f, \tHOM: %.3f' % (ARI, AMI, NMI, HOM))
RNA to ATAC:
ARI: 0.874,     AMI: 0.912,     NMI: 0.918,     HOM: 0.982,     COM: 0.862